Both the RAFI Dynamic Multi-Factor Index and RAFI Multi-Factor Index series are broadly diversified across five factors: value, low volatility, quality, momentum, and size. While each index provides relatively lower tracking error and potentially less volatility than single-factor strategies, the index will underperform in certain market environments. Periods of strong market performance or environments in which a couple of factors underperform significantly will pose headwinds for the strategy.
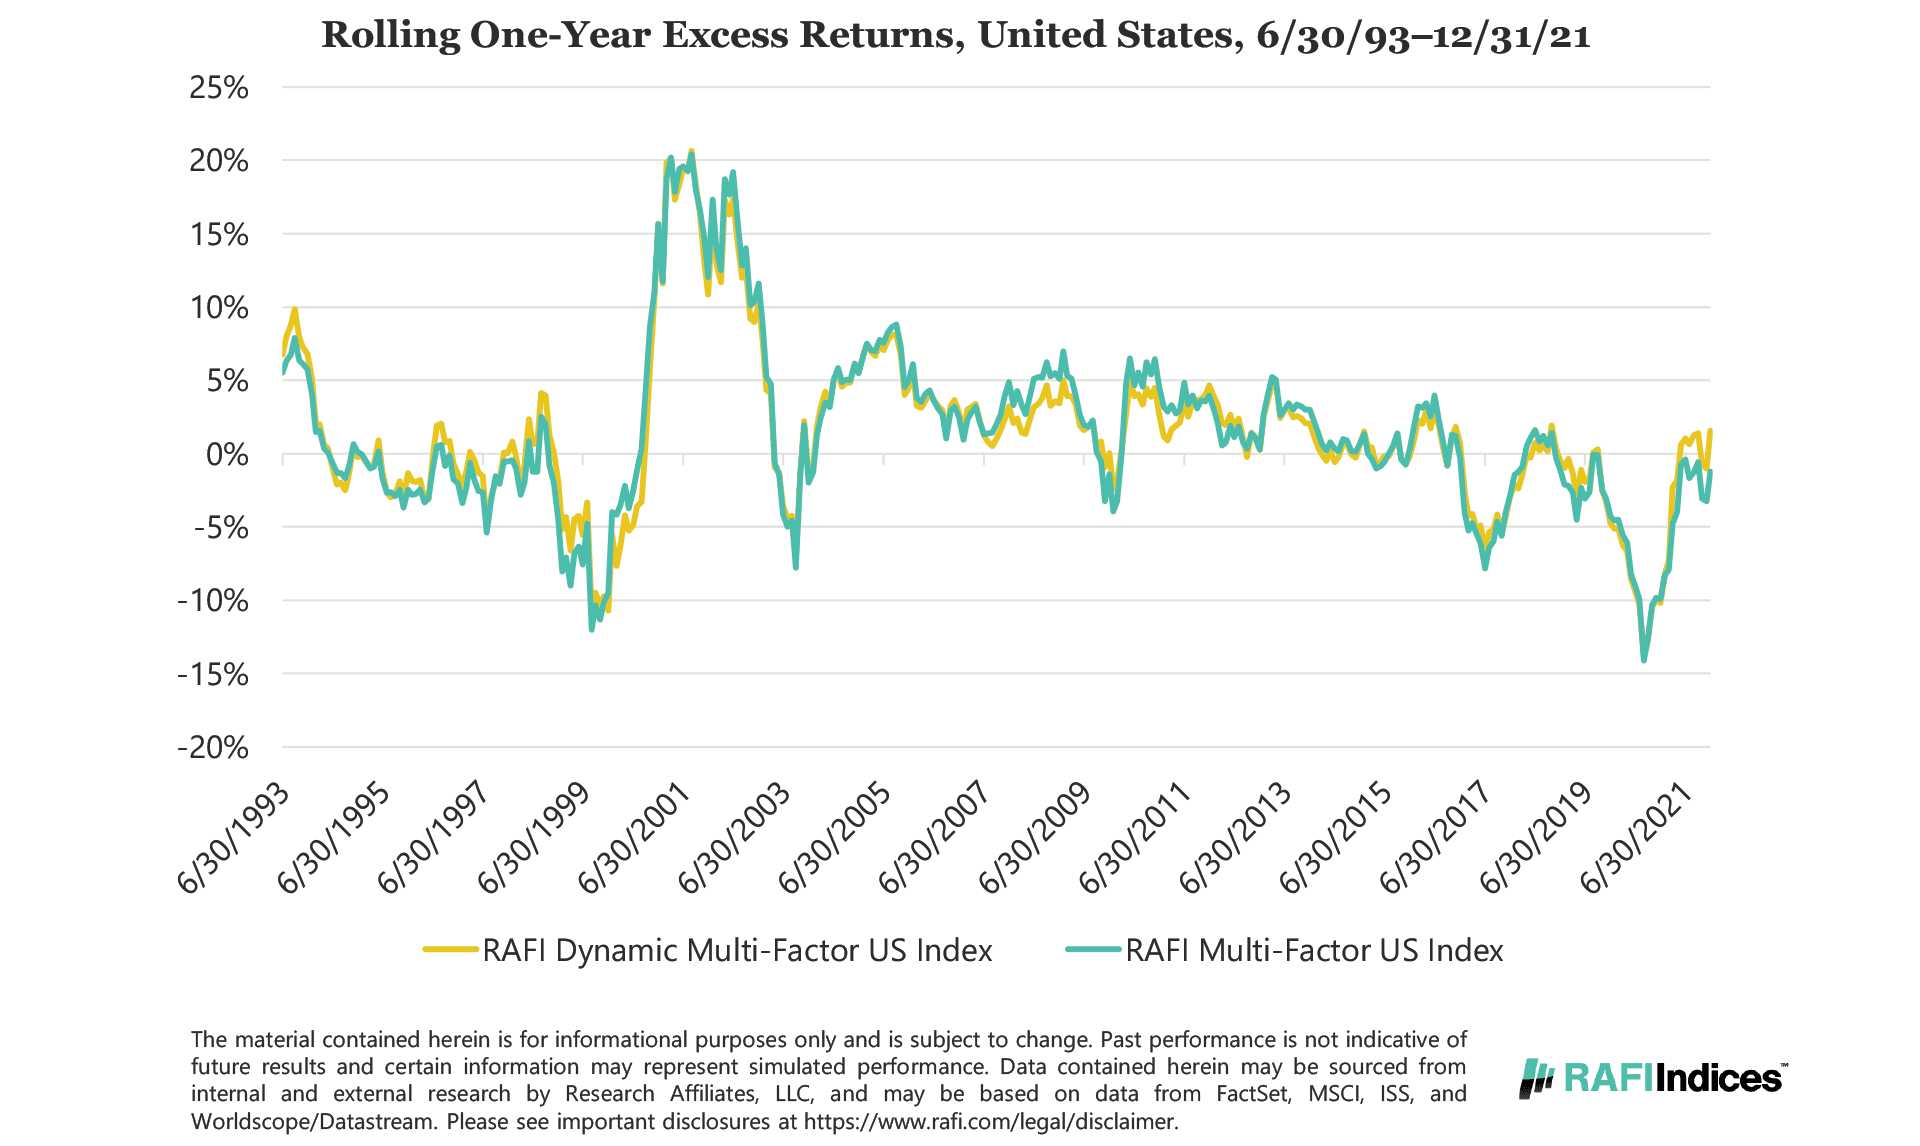
United States
The chart below plots the rolling one-year excess returns of the RAFI Dynamic Multi-Factor US Index compared to the Russell 3000 Index.
There are four periods of notable underperformance for both the Dynamic Multi-Factor Index and the Multi-Factor Index: the late 1990s, 2003, the late 2000s, and mid-2017. The late 1990s (the tech bubble) was characterized by strong market performance in which four (value, low volatility, quality, and size) of the five single-factor strategies significantly underperformed the market. These four strategies have one thing in common: they all contain an element of contrarian rebalancing because they are fundamentally weighted, after selection by desired characteristic. Any strategy that systematically rebalanced during this period suffered.
In the period from October 2002 through September 2003, the index underperformed the benchmark by approximately 7.0%. This was a period of strong market performance, with the Russell 3000 Index up ~25.0%. Three of the five factors underperformed the market during this 12-month period: low volatility by 14.0%, quality by 6.5%, and momentum by 12.2%. Value and size were actually the largest allocations to the dynamic index at this time (21.2% for value and 24.2% for momentum), however, the significant underperformance of the other three single-factor strategies overpowered these two factors’ strong showing.
The global financial crisis in the late 2000s was a third period of underperformance for the RAFI Dynamic Multi-Factor US Index. During the 12-month period ending February 2010, the RAFI Dynamic Multi-Factor Index underperformed versus the Russell 3000 Index by 3.95% and the Dynamic Multi-Factor Index underperformed by 2.40%. Although both indices performed well during the run up to the global financial crisis, when the market rebounded off its September 2009 low, the single-factor strategies did not keep pace with the market’s strength.
The most recent period of underperformance occurred in mid-2017 for reasons similar to those seen during the tech bubble in the late 1990s. During the second and third quarters of 2017, momentum was the only factor to outperform the market. In the Dynamic Multi-Factor Index, the allocation to momentum was highest during the second and third quarters (23.92% and 27.00% respectively) but not high enough to compensate for the underperformance of the other factors.
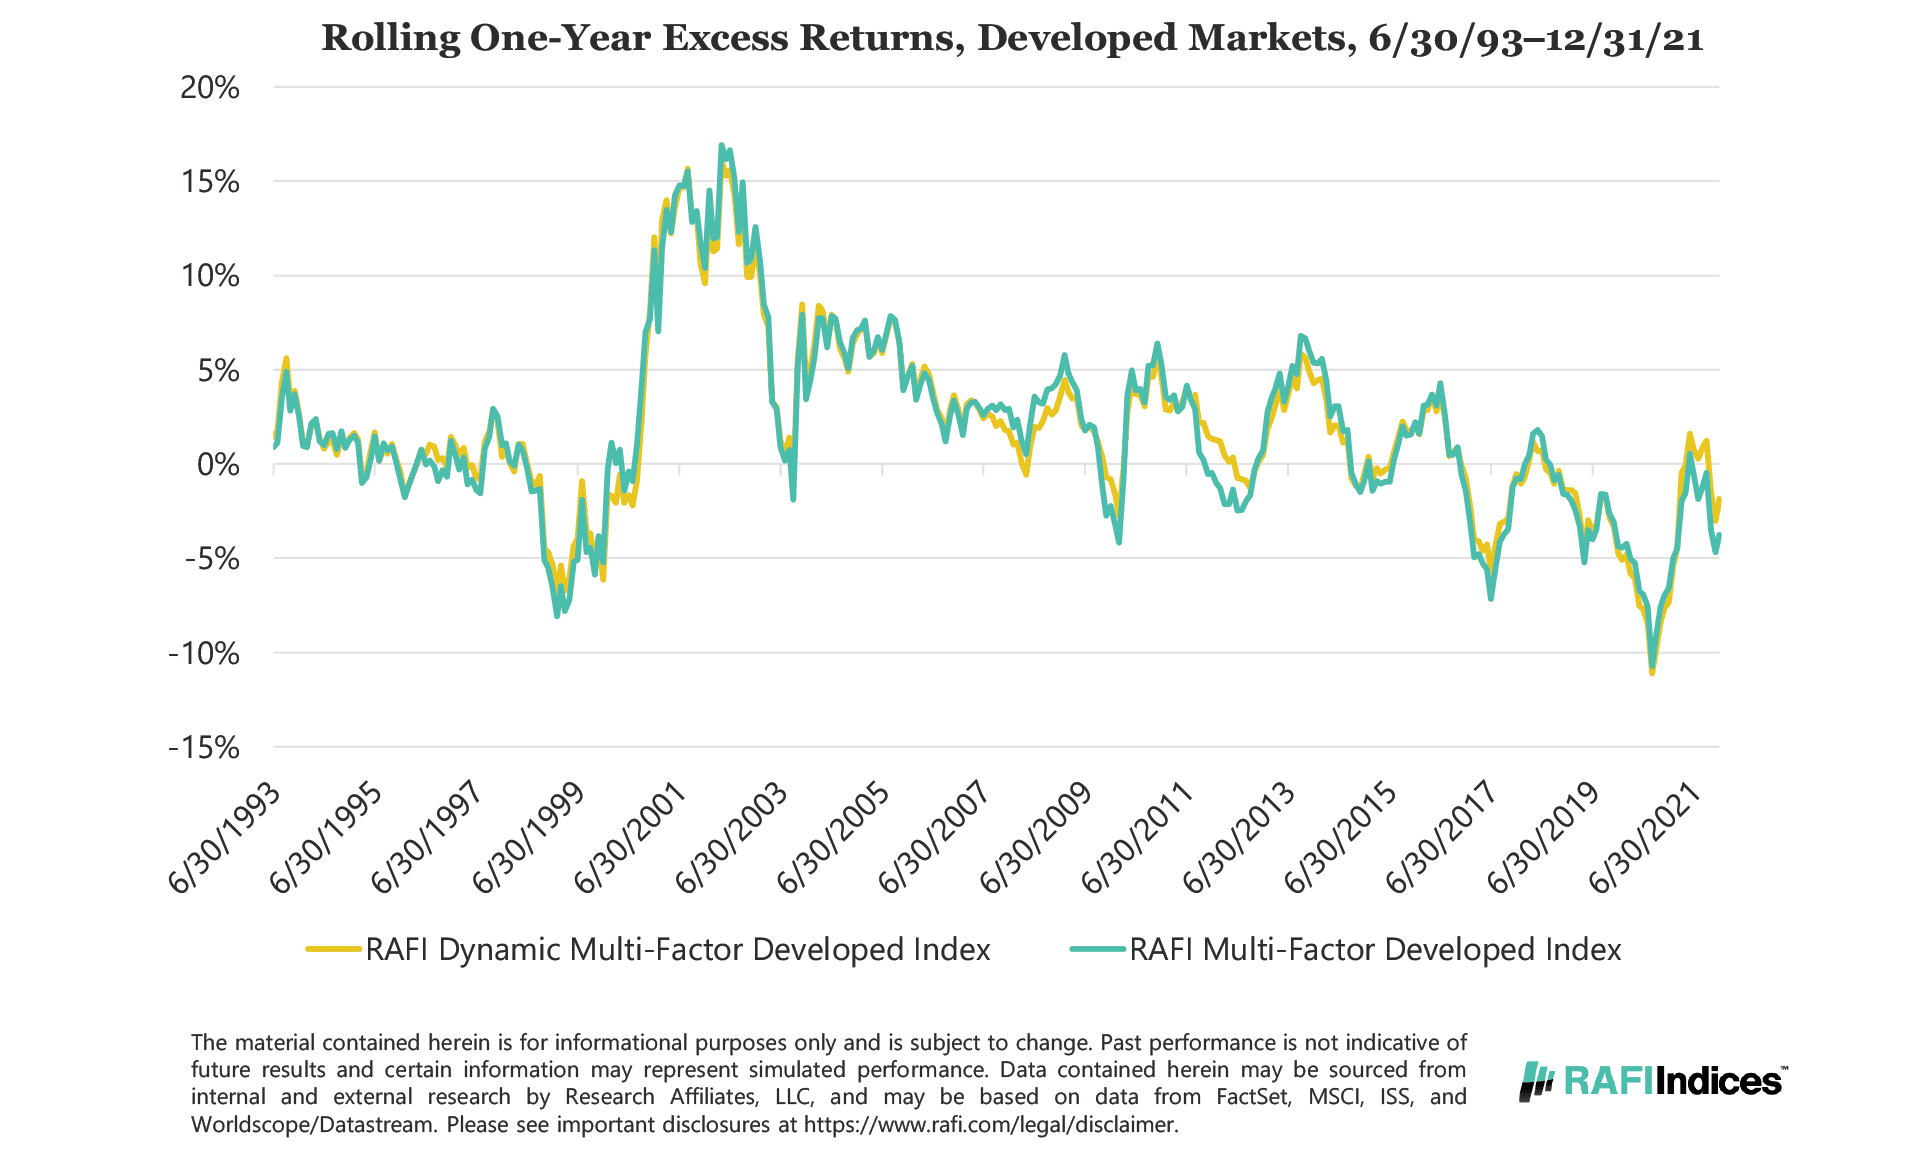
Developed Markets
The chart below plots the rolling one-year excess returns of the RAFI Dynamic Multi-Factor Index and the RAFI Multi-Factor Index compares to the MSCI World Index.
Similar to the US market, both the Developed Dynamic Multi-Factor Index and the Developed Multi-Factor Index experienced drawdowns during the tech bubble in the late 1990s, the late 2000s, and mid-2017. Developed markets also experienced a drawdown in late 2003, albeit to a lesser extent. The reason for the underperformance is consistent with the explanation above.
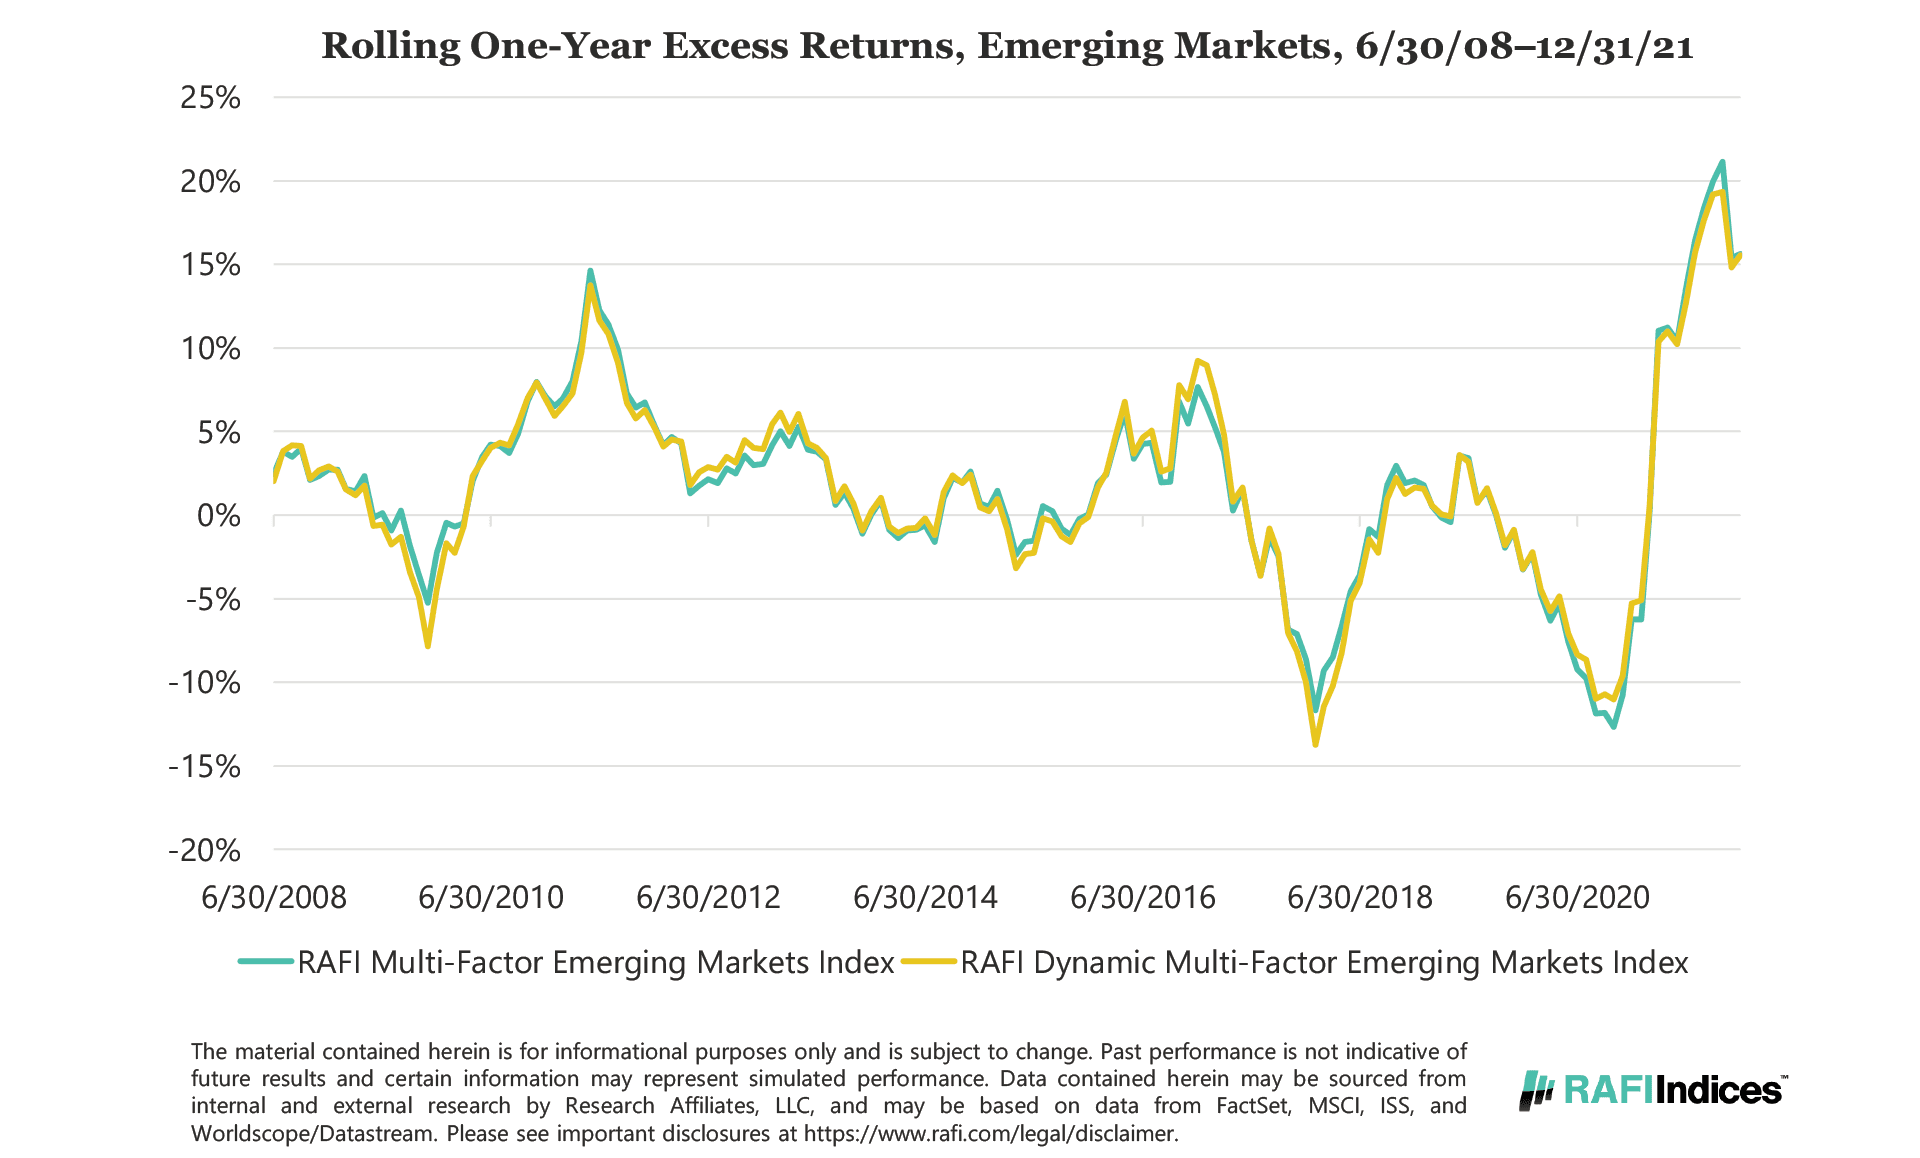
Emerging Markets
The chart below plots the rolling one-year excess returns of the RAFI Dynamic Multi-Factor Index and the RAFI Multi-Factor Index compared to the MSCI Emerging Markets Index.
Similar to Developed and US markets, both the Dynamic Multi-Factor Index and the Multi-Factor Index experienced significant drawdowns during the end of 2009 and mid 2017 in the Emerging Markets region. The reason for the underperformance is consistent with the explanation above.
The material contained in this document is for information purposes only. This material is not intended as an offer or solicitation for the purchase or sale of any security or financial instrument, nor is it advice or a recommendation to enter into any transaction. RAFI Indices, LLC, its affiliates, agents, and each of their respective officers, directors, employees, agents, representatives and licensors (collectively “RI”) does not make any warranties, express or implied, to anyone regarding the information provided herein, including, without limitation, any warranties with respect to the timeliness, sequence, accuracy, completeness, currentness, merchantability, quality or fitness for a particular purpose or any warranties as to the results to be obtained by any third-party in connection with the use of the information. Nothing contained in this material is intended to constitute legal, tax, securities or investment advice, nor an opinion regarding the appropriateness of any investment, nor a solicitation of any type. The general information contained in this material should not be acted upon without obtaining specific legal, tax and investment advice from a licensed professional. Investors should be aware of the risks associated with data sources and quantitative processes used to create the content contained herein or the investment management process. Errors may exist in data acquired from third party vendors, the construction or coding of indices or model portfolios, and the construction of the spreadsheets, results or information provided. RI takes reasonable steps to eliminate or mitigate errors, and to identify data and process errors so as to minimize the potential impact of such errors, however RI cannot guarantee that such errors will not occur. Use of this material is conditioned upon, and evidence of, the user’s full release of RI from any liability or responsibility for any loss or damage, direct, indirect or consequential, arising from or related to (i) any inaccuracy or incompleteness in, errors or omissions in the information or (ii) any decision made or action taken by any third party in reliance upon this information. RI shall not be liable to anyone for loss of business revenues, lost profits or any indirect, consequential, special or similar damages whatsoever, whether in contract, tort or otherwise, even if advised of the possibility of such damages.
